The following is a tutorial I put together to take you through the process of connecting to Tripwire’s vulnerability and exposure (VnE) virtual appliance API using Python 3, capturing vulnerability scanning data and then outputting it graphically using another web service, plot.ly.
Pre-requisites
To follow through with the following exercises you’ll need:
- An IP360 VnE virtual machine – ideally this should already have completed a scan with some data in order to provide sample data to work with (many of the examples may result in errors otherwise!).
- A machine with Python (version 3.x or greater) installed and internet access.
About IP360
Tripwire IP360 is Tripwire’s vulnerability detection tool and helps gather information about networks (what devices there are, what network address they have), how devices are configured (what applications are detected on the devices) alongside the vulnerabilities that exist on the devices.
Scanning with IP360
IP360 has two components- a Vulnerability and Exposure (VnE) Manager and Device Profiler’s (DP). The VnE directs the DP to carry out scanning on a periodic (or on demand basis) based on the settings configured on the VnE Manager.
Key Ip360 Configuration Parameters
For the purposes of this exercise we’ll touch on four of the key configuration components of IP360:
- Networks
- Scan Profiles
- Scheduled Scans
- Scan Results
![2018-02-11 12_11_29-Tripwire IP360 - API Worksheets.docx [Read-Only] - Word](https://nextnextnextfinished.files.wordpress.com/2018/02/2018-02-11-12_11_29-tripwire-ip360-api-worksheets-docx-read-only-word.png)
Working with IP360
All of the settings noted in the previous section can be configured in the web interface. Each configuration component has its own “widget” to manage:
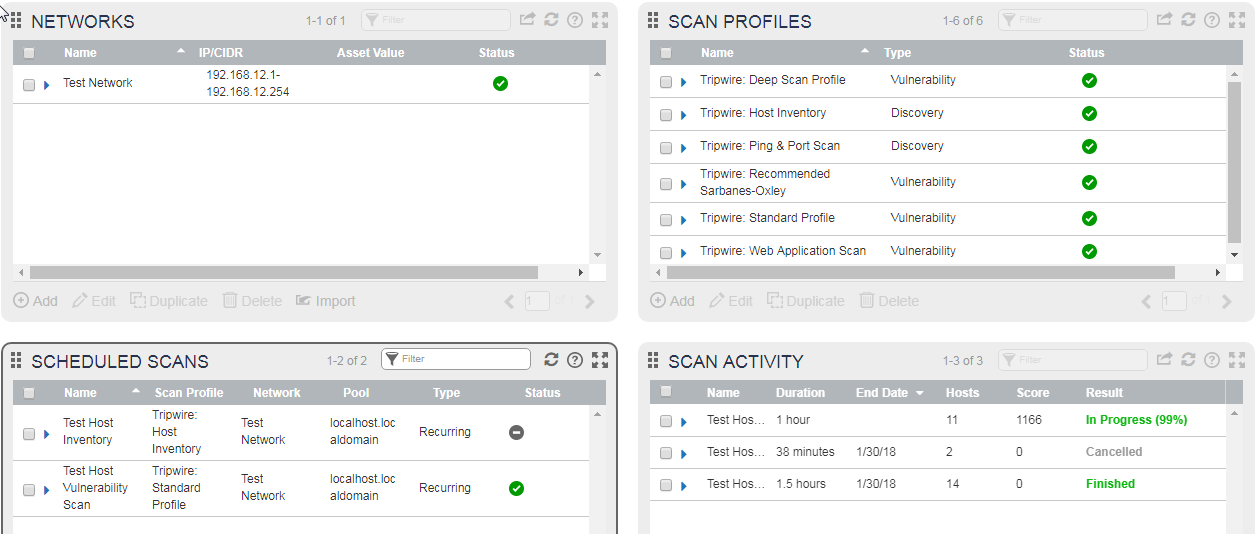
You can modify (or review the settings) of any component by putting a check mark against one of the items and clicking edit:

About the IP360 API
The API included with Tripwire IP360 enables users to programmatically command and control the functionality of Tripwire IP360 through the use of scripts. By using scripts, you can remotely control Tripwire IP360 and integrate it with third-party products. Programmers can take the next step and wrap those scripts in their desired code to create a useful procedure batch to be run according to their own timing and usage goals. Tripwire IP360 functionality is available through the API just like it is through the user interface, and is limited only by the availability of API calls corresponding to those functions.
API Supporting Documentation
There is supporting documentation for the IP360 API available directly from the VnE web interface on https://VNEIP/documentation/admin/Default_Left.html (replacing VNEIP with the address used by the VNE). Additionally there is a helpful utility built into IP360 to test API functionality: https://vneIP/APIExplorer.html#

In the following activities we will connect to the IP360 API and capture some data out from a recent vulnerability scan. The following examples will use Microsoft Visual Studio Code a free IDE available on multiple platforms but you can follow along in your preferred IDE if you wish!
Activity- Setting Up your IDE (Visual Studio Code)
- Install Python 3.6.4 from https://www.python.org/downloads/ and install using the default options.
- Visit https://code.visualstudio.com/download to download the relevant version of Visual Studio Code and install using the default options
- Install the Python extension for Visual Studio Code from https://marketplace.visualstudio.com/items?itemName=ms-python.python
- Launch Visual Studio Code.
- Select your Python version From within VS Code, select a version of Python using the Python: Select Interpreter command on the Command Palette (Ctrl+Shift+P), or by using the Select Python Environment option on the Status Bar if available.
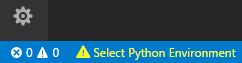
The command presents a list of available interpreters that VS Code can find automatically and should allow you to select the Python version you installed in the first step.
Activity- Connecting to IP360 and Getting Information
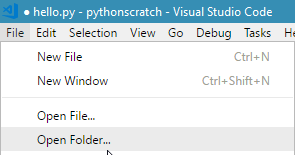
- Create a new folder for your work, and open this in Visual Studio Code:
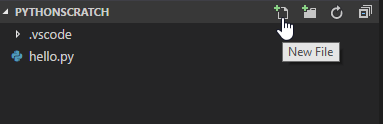
- Create a new python file by clicking on your folder name and entering a filename ending in py (ip360.py).
- To test your IDE you can run a simple print introduction with:
# IP360 API Tutorial Example Script

msg = "IP360 API Example"

print(msg)
- We can then quickly run this with the following command at the debug console:
python3 ip360.py
- Next we can start setting up our connection to IP360. First, we’ll create variables representing the username, password and network IP address of the VNE:
USERNAME = "ip360@tripwire.com"

PASSWORD = "Tripwire"

VNEADDRESS = "192.168.0.58"
- Then we’ll import the relevant modules:
import xmlrpclib

import ssl
- Since we aren’t using a trusted SSL certificate (see https://www.digicert.com/ssl-support/certificate-not-trusted-error.htm for more information about certificates) we need to tell Python to ignore the SSL certificate during our test script setup:
try:

    _create_unverified_https_context = ssl._create_unverified_context

except AttributeError:

    # Legacy Python that doesn't verify HTTPS certificates by default

    pass

else:

    # Handle target environment that doesn't support HTTPS verification

    ssl._create_default_https_context = _create_unverified_https_context
- Next we’ll test our connection – we’ll create a serverproxy for the API to make it easier to interact with:
server = xmlrpclib.ServerProxy("https://"+VNEADDRESS+"/api2xmlrpc")
- Then we can store the resulting sessionID (which we can use for later interactions with the API) by passing our username and password:
sessionID = server.login(2,0,USERNAME,PASSWORD)
- Next we can make a call to the API. We’ll do a request against the getUserObject
result = server.call(sessionID, "SESSION", "getUserObject",{})
- And print the results:
print "My user object is %s" % (result)
The resulting output should look something like the below:

About- Getting More data
Let’s have a closer look at how to request different data from the VnE. The server.call takes several parameters –
- a sessionid which we use to identify ourselves to the device.
- a class to call to get the relevant data,
- a method to get the relevant
- and finally, a parameters list (so far we’ve just used blank values).
Let’s look at another simple call- retrieving version information:
version = server.call(sessionID, "class.VNE", "getVersionInfo",{})
print "VnE version information is %s" % (version)
Our server.call is very similar to the one we used to retrieve our user object information – except this time we have a new class (class.VNE) and method (getVersionInfo). If you’re not too sure what Class and Method options you have, you can have a look in the Help for IP360’s API:
Alternatively, you can use the API Explorer to look at what the Request XML was:

In the API Explorer when you run a search you can click on the Show Request XML
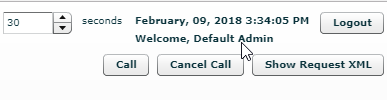
to give you a window with the request XML used by the Explorer utility- in here you can see the class and method called:
Activity- Getting more data
We’re going to build on our simple examples from the previous steps to get more information- let’s start with getting the most recent audit (scan) that occurred on the network:
audit = server.call(sessionID, "class.Audit", "fetch", {'limit' : 1, 'sortBy' : 'id', 'sortOrder' : 'descending'})
print audit
For my test system I get back the audit id of 4. Now we have an audit, we can check what hosts where scanned as part of that audit:
hosts = server.call(sessionID, "class.Host", "fetch",{'query' : 'audit = \'%s\'' % audit})

print hosts
This gives me a list of hosts…
but not a lot else, so let’s use that data to get more info. First, we need to know what attributes we’re trying to get data for so we ask the Class.Host for an attribute list with the method getAttributes:
attributes = server.call(sessionID, "class.Host", "getAttributes", {})

print "Attributes for a host includes:"

print attributes

giving us:

Attributes for a host includes:

['audit', 'customScore', 'customer', 'domainName', 'hostScore', 'id', 'ifaceMacAddress', 'ipAddress', 'macAddress', 'name', 'netbiosName', 'network', 'os', 'osFprint', 'portSignature', 'tarpit', 'timeStamp', 'vulnerabilities']
OK, now we know what all our attributes are, we can ask for each of these
# Let's pick a single host to test with for now:

host = "Host.30"
and ask for each of the host’s attributes with a for loop working through each (attrib) in attributes:
print "Host details"

for attrib in attributes:

    hostdetail = server.call(sessionID, host, "getAttribute", {'attribute': a, })

    print attrib + ":"
     print hostdetail
Now we’ve got some interesting data like how well it’s scored, what it’s address is, etc.:
hostScore:

565

netbiosName:

network:

Network.2

os:

OS.20

osFprint:

/

portSignature:

126530483294762351

tarpit:

False

timeStamp:

1517330219

vulnerabilities:

2
What if we wanted to get all the IP addresses and scores for ALL the hosts- well we can do that with another for loop
OK, how about getting the IP and scores for all the hosts?
for h in hosts:

    #Get the host IP

    hostIPaddress = server.call(sessionID, h, "getAttribute", {'attribute':'ipAddress'})

    # And it's score

    hostScore = server.call(sessionID, h, "getAttribute", {'attribute':'hostScore'})

    # Print them

    print "Host: " + hostIPaddress + " scored: "

    print hostScore
Now I have some IP’s and scores:
Host: 192.168.12.250 scored:

12282

Host: 192.168.12.99 scored:

36429

Host: 192.168.12.101 scored:

0
(Optional) Activity- Getting Even More data
From the examples in the previous section you can see how we can get some score data that we’ll use later in our integration example, but there’s much more data in the API you might be interested- have a look at the example below that shows the vulnerability details for all the detected vulnerabilities (so you can see the port, protocols, and details from your scanning:
# Carrying on from before, and now we have some hosts, let's get some vuln results

vulns = server.call(sessionID, "class.VulnResult","search",{'query' : 'host = \'%s\'' % host})

print vulns

# Not very interesting - we want the vulnerability details:

attributes = server.call(sessionID, "class.vulnResult", "getAttributes", {})

print "Attributes for a vulnresult includes:"

print attributes

for v in vulns:

    for a in attributes:

        vulnDetails = server.call(sessionID, v, "getAttribute", {'attribute': a})

        print a+":"

        print vulnDetails
Now that you have some data from IP360 we can have a look at using the data in an interestingly way. There’s a variety of visualisation frameworks available for Python but for our purpose’s we’ll use Plot.ly – a free web service that lets you create graphs from your data.
Activity- Creating an Account
- Create a free account on plot.ly (https://plot.ly/ by entering your email address, desired username and password:
- Once registered you can get your API key via https://plot.ly/settings/api (HINT: you may need to click “Regenerate Key” to show the API key value)
Activity- Installing and Connecting to your Account
- Logon to your Linux machine or Visual Studio and get the dependencies for running Plot.ly (if you’re using Visual Studio code you can run this in the terminal window):
sudo apt-get install imagemagick libmagickcore-dev libmagickwand-dev libmagic-dev

sudo apt-get install imagemagick
- Install plot.ly:
sudo pip3 install plotly

pip3 install plotly –upgrade
# Used to generate random data for testing
pip3 install numpy
or, if you’re in the visual Studio Code terminal you can run pip install plotly and pip install numpy directly:
- We can now create a test python file to verify your account. In Visual Studio code you can simply add a new .py file:
- In the new plot.ly import the plot.ly toolset and add your credentials (don’t forget to update your username and APIkeyfield values):
import plotly

plotly.tools.set_credentials_file(username='yourusername', api_key='yourAPIkeyHere')

import plotly.plotly as py

import plotly.graph_objs as go
- Now we can generate some test data to work with quickly using numpy:
# Create random data with numpy

import numpy as np

N = 500

random_x = np.linspace(0, 1, N)

random_y = np.random.randn(N)
- Now we can plot this data with:
# Create a plot

trace = go.Scatter(

    x = random_x,

    y = random_y

)

data = [trace]

py.iplot(data, filename='basic-line')
- When we run the script we can check the results out on the Plot.ly file pages: https://plot.ly/organize/home/

Now that we have both IP360 and Plot.ly configured we can combine the two to presenting the data graphically.
Activity– Combining IP360 and Plot.ly
- Let’s start by repeating our plot.ly setup
import plotly

plotly.tools.set_credentials_file(username='yourusername', api_key='yourAPIkeyHere')

import plotly.plotly as py

import plotly.graph_objs as go
- Then get data from IP360 and add them to a list (the xval for the x-axis, and yval for the v axis)
# Get data from IP360

print "************************************************"

xval = []

yval = []

for h in hosts:

    #Get the host IP

    hostIPaddress = server.call(sessionID, h, "getAttribute", {'attribute':'ipAddress'})

    # And it's score

    hostScore = server.call(sessionID, h, "getAttribute", {'attribute':'hostScore'})

    xval.append(hostIPaddress)

    yval.append(hostScore)

print "************************************************"

print xval

print yval

print "************************************************"
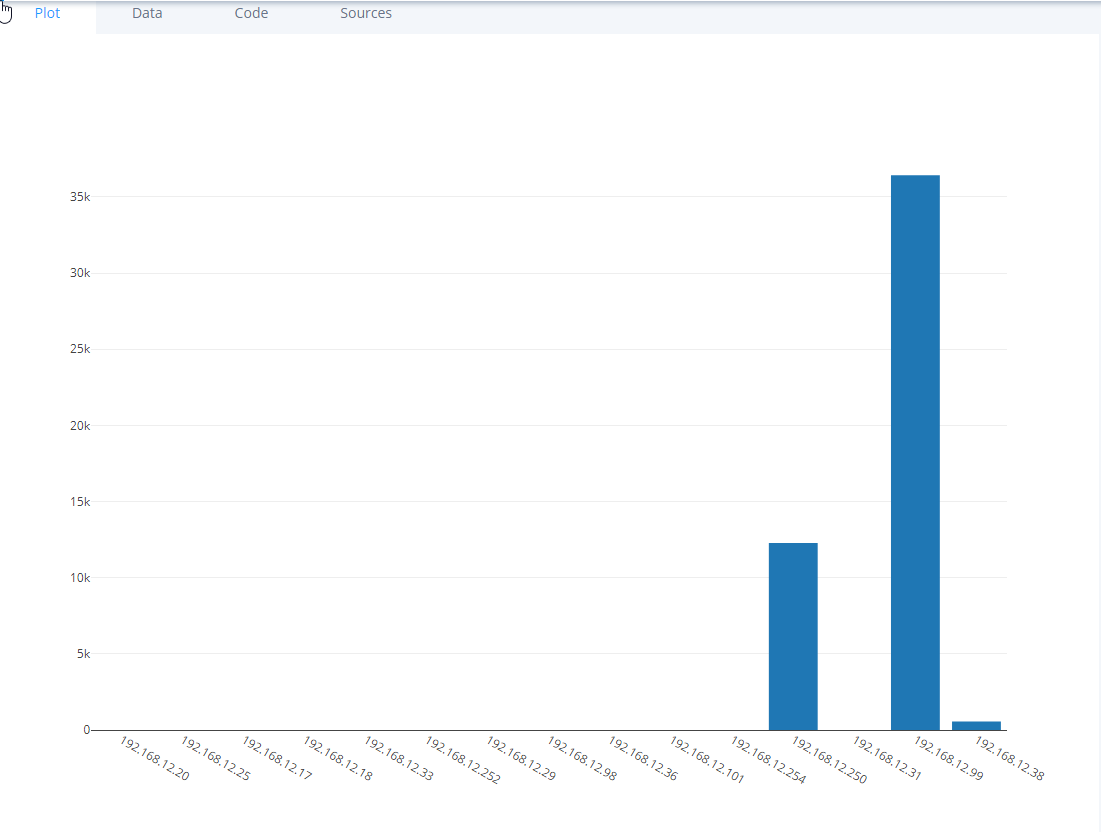
- Finally, we can generate a graph with our data. This time we’ll create a bar chart, so the code will look like:
# Create a bar graph

data  = [go.Bar(

    x = xval,

    y = yval

)]

py.iplot(data, filename='basic-bar')
- This will give you a new graph on the Plotly site looking something like the graph below:
Moving on
There is a lot more you can do with the data and plot.ly API – for example:
IP360 Data:
- You can pull back individual vulnerabilities, or applications from the data- a stacked bar graph showing applications on hosts, or vulnerability counts can easily be built from the foundations in the previous sections.
Presentation: